Note: Support for 3D on mobile devices may vary, view the system requirements for more information.
This sample demonstrates how to generate a default popupTemplate and label for point clusters enabled in a MapView. To generate a popupTemplate, call the getTemplates() method in the esri/smartMapping/popup/clusters module. Use the getLabelSchemes() method in esri/smartMapping/labels/clusters to generate suggested default labelingInfo for the clusters along with a suggested clusterMinSize.
function generateClusterConfig(layer){

  // generates default popupTemplate for clusters
  const popupPromise = clusterPopupCreator
    .getTemplates({
      layer: layer
    })
    .then(function (popupTemplateResponse) {
      // Return the primary popup template. There
      // may be suggested secondaryTemplates you can use
      // in popupTemplateResponse.secondaryTemplates.
      return popupTemplateResponse.primaryTemplate.value;
    });

  // generates default labelingInfo
  const labelPromise = clusterLabelCreator
    .getLabelSchemes({
      layer: layer,
      view: view
    })
    .then(function (labelSchemes) {
      // returns the primary label scheme (usually the cluster count)
      // There may be secondary label schemes containing summary information
      // such as the average value of a number field of features within
      // each cluster, or the predominant value of a string field.
      return labelSchemes.primaryScheme;
    });

  return promiseUtils.eachAlways([popupPromise, labelPromise]).then(function(result){

    const popupTemplate = result[0].value;

    const primaryLabelScheme = result[1].value;
    const labelingInfo = primaryLabelScheme.labelingInfo;
    // Ensures the clusters are large enough in screen size to fit labels
    const clusterMinSize = primaryLabelScheme.clusterMinSize;

    // construct the featureReduction object to set on the feature layer
    return {
      type: "cluster",
      popupTemplate: popupTemplate,
      labelingInfo: labelingInfo,
      clusterMinSize: clusterMinSize
    };
  }).catch(function(error){
    console.error(error);
  });
}
Clustering is enabled via the featureReduction property of the FeatureLayer.
layer.when()
  .then(generateClusterConfig)
  .then(function (featureReduction) {
    layer.featureReduction = featureReduction;
  });
Since a layer's featureReduction property is independent of its renderer, the symbol and popupTemplate of the cluster graphics can be used to summarize features comprising the cluster. See Clustering styles and configurations for more information about the various ways clusters can summarize the points they represent.
The layer in this sample visualizes places of worship with a UniqueValueRenderer. When clustering is enabled, each cluster is assigned the symbol of the most common uniqueValueInfo among the features in the cluster.
| Display all points | Display clustered features |
|---|---|
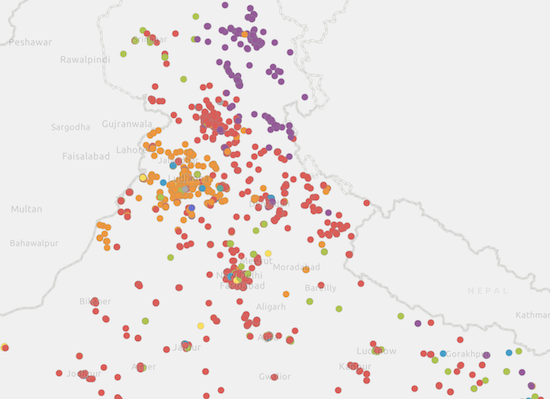 | 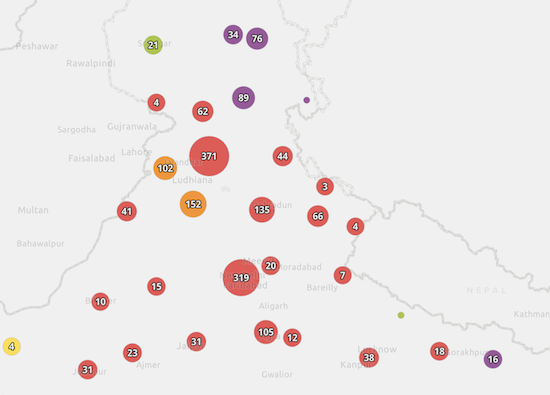 |
You can reference the predominant value of a cluster in the popupTemplate. For layers with a UniqueValueRenderer, the summary field name follows this format: {cluster_type_fieldName}. In this case, the renderer visualizes unique values in the religion field, so the aggregate field name to reference in the popupTemplate is {cluster_type_religion}.
This sample also demonstrates how you can explore and filter a layer by category with clustering enabled the same way you would on a non-clustered layer. When a filter is applied to the layer view of a clustered layer, the clusters will recompute client-side and only display information complying with the filter.
filterSelect.addEventListener("change", function(event){
  const newValue = event.target.value;
  const whereClause = newValue ? "religion = '" + newValue + "'" : null;
  layerView.filter = {
    where: whereClause
  };
  // close popup for former cluster that no longer displays
  view.popup.close();
});
Related samples and resources
- Point clustering - basic configuration
- Point clustering - advanced configuration
- Point clustering - query cluster features
- Point clustering with visual variables
- Filter features by attribute
- API reference - FeatureReductionCluster